清华大佬耗费三个月吐血整理的几百G的资源,免费分享!....>>>
基本思路:
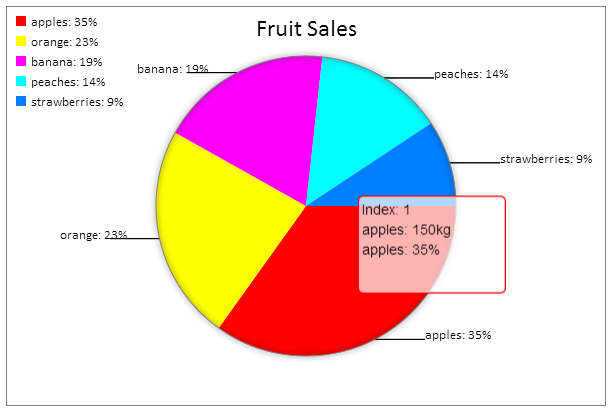
主要是利用HTML5 Canvas实现饼图绘制,绘制弧度的API主要是使用
context.arc与lineto两个API。
实现的功能有:
1. 支持标签Legend显示或者隐藏
2. 首次载入动画效果
3. 鼠标tooltip效果
4. 自定义饼图大小与是否添加文字
效果如下:
调用代码:
<html>
<head>
<meta http-equiv="X-UA-Compatible" content="chrome=IE8">
<script src="js/fishcomponent.js"></script>
<script src="js/pie.js"></script>
<title>My Demo 1</title>
	<script>
	window.onload = function() {
		var canvas = document.getElementById("pie_canvas");
		var seriesData = [{name:"apples", value:150, color:"RGBA(255,0,0,1)"},
		              {name:"orange", value:100, color:"RGBA(255,255,0,1)"},
		              {name:"banana", value:80, color:"RGBA(255,0,255,1)"},
		              {name:"peaches", value:60, color:"RGBA(0,255,255,1)"},
		              {name:"strawberries", value:40, color:"RGBA(0,127,255,1)"}]
		var config = {
				width : 600,
				height: 400,
				series: seriesData,
				canvas: canvas,
				unit: "kg",
				title:"Fruit Sales",
 				tooltips : {
					enable : true
				},
				animation :{
					enable: true
				},
			    legend : {
			    	enable : true
			    },
			    text : {
			    	enable: true
			    },
		};
		pieChart.initSettings(config);
		pieChart.render();
	}
	</script>
</head>
<body>
<h1>Pie Chart Demo</h1>
<div id="my_container" style="width:600px; height:500px;">
	<canvas id="pie_canvas"></canvas>
</div>
<div id="btn-group">
	<button type="button" id="clear-button">Clear Plot</button>
	<button type="button" id="refresh-button">Draw Plot</button>
</div>
</body>
</html>
饼图JS的代码:
var pieChart = {
    width: 600,
    height: 400,
    series: [],
    unit: "kg",
    chartCanvas: null,
    selectable : true,
    title: "Pie Chart",
    legend : {
    	enable : true
    },
    edge : {
    	width: 50,
    	height: 50
    },
    animation: {
    	enable: true,
    	animCanvas : null,
    	hh: 1, // trick is here!! for animation play
    	pctx: null
    },
    tooltips: {
    	enable: true,
    	tooltipCanvas : null,
    	ttContext: null,
    	index: -1
    },
    circle : {
    	cx: 0,
    	cy: 0,
    	radius: 0

    },
    text : {
    	enable: false,
    	content:[]
    },

    initSettings: function (config) {
    	this.chartCanvas = config.canvas;
    	this.chartCanvas.width = config.width;
    	this.chartCanvas.height = config.height;
        this.width = config.width;
        this.height = config.height;
        this.series = config.series;
        this.title = config.title;
        this.unit = config.unit;
        if(config.tooltips != undefined) {
        	this.tooltips.enable = config.tooltips.enable;
        }
        if(config.animation != undefined) {
        	this.animation.enable = config.animation.enable;
        }
        if(config.legend != undefined) {
        	this.legend.enable = config.legend.enable;
        }
        if(config.text != undefined) {
        	this.text.enable = config.text.enable;
        }
    },

    render : function() {
    	// initialization circle
    	this.circle.cx = this.width/2;
    	this.circle.cy = this.height/2;
    	this.circle.radius = Math.min(this.width/2, this.height/2) - Math.max(this.edge.width, this.edge.height);
    	var ctx = null;
    	if(this.animation.enable) {
    		this.animation.animCanvas = document.createElement("canvas");
        	this.animation.animCanvas.width = this.width;
        	this.animation.animCanvas.height = this.height;
        	ctx = this.animation.animCanvas.getContext("2d");
    	} else {
    		ctx = this.chartCanvas.getContext("2d");
    		this.renderBorder(ctx);
    	}

    	if(this.circle.radius <= 0) {
    		ctx.strokeText("Can not reader the chart, Circle is too small.");
    		return;
    	}

    	// draw each arc according to data series
    	var sum = 0;
    	var nums = this.series.length;
    	for(var i=0; i<nums; i++) {
    		sum += this.series[i].value;
    	}

    	// draw title
    	ctx.font = '18pt Calibri';
    	ctx.fillText(this.title, this.width/2 - this.edge.width, 30);
    	ctx.save();
    	var deltaArc = 0;
    	for(var i=0; i<nums; i++) {
    		var precent = this.series[i].value/sum;
    		this.renderPie(ctx, i, precent, deltaArc);
    		deltaArc += 2*Math.PI * precent;
    	}
    	ctx.restore();

    	// add blur shadow
    	ctx.save();
    	ctx.shadowColor = "black";
    	ctx.shadowOffsetX = 0;
    	ctx.shadowOffsetY = 0;
    	ctx.shadowBlur = 10;
    	ctx.beginPath();
    	ctx.arc(this.circle.cx, this.circle.cy, this.circle.radius, 0, Math.PI * 2, false);
    	ctx.closePath();
    	ctx.lineWidth = 1;
    	ctx.strokeStyle = "RGBA(127,127,127,1)";
    	ctx.stroke();
    	ctx.restore();

    	// render legend
    	ctx.save();
    	this.renderLegend(ctx, sum);
    	ctx.restore();

    	// play animation
    	if(this.animation.enable) {
    		var parent = this;
    		this.animation.pctx = this.chartCanvas.getContext("2d");
    		this.renderBorder(this.animation.pctx);
    		setTimeout(function() {parent.playAnimation(parent);}, 1000/20);
    	}
    },

    showTooltips : function(loc, ctx) {
    	if(!this.tooltips.enable) {
    		return;
    	}
    	var dx = loc.x - this.width/2;
    	var dy = loc.y - this.height/2;
    	var dis = Math.floor(Math.sqrt(dx * dx + dy * dy));
    	if(dis <= this.circle.radius) {
    		// draw tool tip text
    		var angle = Math.atan2(dy,dx);
    		if(angle <= 0) {
    			// if[-Math.PI, 0], make it[Math.PI, 2*Math.PI]
    			angle = angle + 2*Math.PI;
    		}

        	var sum = 0;
        	var nums = this.series.length;
        	for(var s=0; s<nums; s++) {
        		sum += this.series[s].value;
        	}

        	var deltaArc = 0;
        	var index = 0;
        	for(var i=0; i<nums; i++) {
        		var precent = this.series[i].value/sum;
        		deltaArc += 2*Math.PI * precent;
        		if(angle<=deltaArc) {
        			index = i;
        			break;
        		}
        	}
    		if(this.tooltips.tooltipCanvas == null) {
    			this.tooltips.tooltipCanvas = document.createElement("canvas");
    			this.tooltips.ttContext = this.tooltips.tooltipCanvas.getContext("2d");
        		this.tooltips.tooltipCanvas.width = 150;
        		this.tooltips.tooltipCanvas.height = 100;
    		}

    		// only draw once
    		// if(index == this.tooltips.index){
    		// 	return;
    		// }
    		this.clearTooltips(ctx);

    		this.tooltips.index = index;
    		var m_context = this.tooltips.ttContext;
    		m_context.save();
    		m_context.clearRect(0, 0, this.tooltips.tooltipCanvas.width, this.tooltips.tooltipCanvas.height);
    		m_context.lineWidth = 2;
    		m_context.strokeStyle = this.series[index].color;
    		m_context.fillStyle="RGBA(255,255,255,0.7)";
    		// m_context.strokeRect(2, 2, this.tooltips.tooltipCanvas.width-4, this.tooltips.tooltipCanvas.height-4);
    		// m_context.fillRect(2,2,this.tooltips.tooltipCanvas.width-4, this.tooltips.tooltipCanvas.height-4);
    		m_context.roundRect(2,2,this.tooltips.tooltipCanvas.width-4, this.tooltips.tooltipCanvas.height-4, 5, true, true);
			m_context.font="14px Arial";
			m_context.fillStyle="RGBA(0,0,0,1)";
			m_context.fillText("Index: " + (index + 1), 5, 20);
			m_context.fillText(this.series[index].name + ": " + this.series[index].value + this.unit, 5, 40);
			m_context.fillText(this.series[index].precent, 5, 60);
			m_context.restore();

			// make tool-tip rectangle is always visible
			if((loc.x + this.tooltips.tooltipCanvas.width)> this.width) {
				loc.x = loc.x - this.tooltips.tooltipCanvas.width;
			}
			if((loc.y - this.tooltips.tooltipCanvas.height) <= 0) {
				loc.y = loc.y + this.tooltips.tooltipCanvas.height;
			}
			ctx.drawImage(this.tooltips.tooltipCanvas, 0, 0, this.tooltips.tooltipCanvas.width, this.tooltips.tooltipCanvas.height,
					loc.x, loc.y-this.tooltips.tooltipCanvas.height, this.tooltips.tooltipCanvas.width, this.tooltips.tooltipCanvas.height);
    	} else {
    		this.tooltips.index = -1;
    		this.clearTooltips(ctx);
    	}
    },

    clearTooltips : function(ctx) {
		ctx.clearRect(0,0,this.width, this.height);
		this.renderBorder(ctx);
		ctx.drawImage(this.animation.animCanvas, 0, 0, this.width, this.height, 0, 0, this.width, this.height);
    },

    renderBorder : function(ctx) {
		ctx.save();
		ctx.fillStyle="white";
		ctx.strokeStyle="black";
		ctx.fillRect(0, 0, this.width, this.height);
		ctx.strokeRect(0, 0, this.width, this.height);
		ctx.restore();
    },

    renderPie : function(ctx, index, precent, deltaArc) {
    	var endAngle = deltaArc + 2*Math.PI*precent;
    	ctx.beginPath();
    	ctx.arc(this.circle.cx, this.circle.cy, this.circle.radius, deltaArc, endAngle, false);
    	ctx.moveTo(this.circle.cx, this.circle.cy);
    	ctx.lineTo(this.circle.cx + this.circle.radius * Math.cos(deltaArc), this.circle.cy + this.circle.radius * Math.sin(deltaArc));
    	ctx.lineTo(this.circle.cx + this.circle.radius * Math.cos(endAngle), this.circle.cy + this.circle.radius * Math.sin(endAngle));
    	ctx.lineTo(this.circle.cx, this.circle.cy);
    	ctx.closePath();
    	ctx.fillStyle = this.series[index].color;
    	ctx.fill();

    	// render text content
    	if(this.text.enable) {
    		var halfEndAngle = deltaArc + Math.PI*precent;
    		var hx = this.circle.cx + this.circle.radius * Math.cos(halfEndAngle);
    		var hy = this.circle.cy + this.circle.radius * Math.sin(halfEndAngle);
    		ctx.beginPath();
    		ctx.moveTo(hx, hy);
    		var linePos = (hx < this.circle.cx) ? (hx - this.edge.width) : (hx + this.edge.width);
    		ctx.lineTo(linePos, hy);
    		ctx.closePath();
    		ctx.strokeStyle="black";
    		ctx.stroke();
    		var textPos = (hx < this.circle.cx) ? (hx - this.edge.width*2) : (hx + this.edge.width);
    		precent = Math.round (precent*100) / 100;
    		var size = this.text.content.length;
    		var tipStr = (size > index) ? this.text.content[index] : this.series[index].name + ": " + (precent * 100).toFixed(0) + "%";
    		ctx.font = '10pt Calibri';
    		ctx.fillStyle="black";
    		ctx.fillText(tipStr, textPos, hy);
    	}
    },

    renderLegend : function(ctx, sum) {
    	if(!this.legend.enable) return;
    	var nums = this.series.length;
    	ctx.font = '10pt Calibri';
    	var pos = (this.width/2 > (this.circle.radius+50)) ? 50 : (this.circle.cx - this.circle.radius);
    	for(var i=0; i<nums; i++) {
    		var x = this.series[i].value/sum;
    		x = Math.round (x*100) / 100;
    		var tipStr =  this.series[i].name + ": " + (x * 100).toFixed(0) + "%";
    		this.series[i].precent = tipStr;
    		ctx.fillStyle = this.series[i].color;
    		ctx.fillRect(pos - 40, 20*i+10, 10, 10);
        	ctx.fillStyle = "black";
    		ctx.fillText(tipStr, pos - 25, 20*i+20);
    	}
    },

    playAnimation : function(parent) {
    	if(parent.animation.hh < parent.height) {
    		parent.animation.pctx.save();
    		parent.animation.pctx.globalAlpha=0.5;
    		parent.animation.pctx.clearRect(0,0,parent.width, parent.height);
    		parent.renderBorder(parent.animation.pctx);
    		parent.animation.pctx.drawImage(parent.animation.animCanvas, 0, 0, parent.width, this.animation.hh, 0, 0, parent.width, this.animation.hh);
    		parent.animation.hh = parent.animation.hh + 10;
    		parent.animation.pctx.restore();
    		setTimeout(function() {parent.playAnimation(parent);}, 1000/20);
    	} else {
    		parent.animation.pctx.clearRect(0,0,parent.width, parent.height);
    		parent.renderBorder(parent.animation.pctx);
    		parent.animation.pctx.drawImage(parent.animation.animCanvas, 0, 0, parent.width, parent.height, 0, 0, parent.width, parent.height);

    		// enable tool-tip functionality
        	if(parent.animation.enable && parent.legend.enable) {
        		parent.chartCanvas.addEventListener('mousemove', function(event) {
    	    		var x = event.pageX;
    	    		var y = event.pageY;
    	    		var canvas = event.target;
    	    		var bbox = canvas.getBoundingClientRect();
    	    		var loc = { x: x - bbox.left * (canvas.width  / bbox.width),
    	    				y: y - bbox.top  * (canvas.height / bbox.height)};

    	    		parent.showTooltips(loc, (parent.animation.enable ? parent.animation.pctx : ctx));
    	        }, false);
        	}
    	}
    },

};
源代码可以直接使用